Animal advocates mobilize amid a ‘crisis’ for pets
A hurricane strikes and a makeshift flotilla races to help
Informational Videos
5 Tips To Survive The Notre Dame – Holy Cross Gateway Program
Meet the Candidates: Notre Dame Student Body Election 2020
Diane Lane unites with members of Congress to fight against ‘shark finning’
‘Rival Gangs’: Alligators are facing a snaky threat in the Florida Everglades
“Mystery Skier:” 13-year investigation solved with help of social media,
This is what it’s like when your job is to catch alligators
Photos
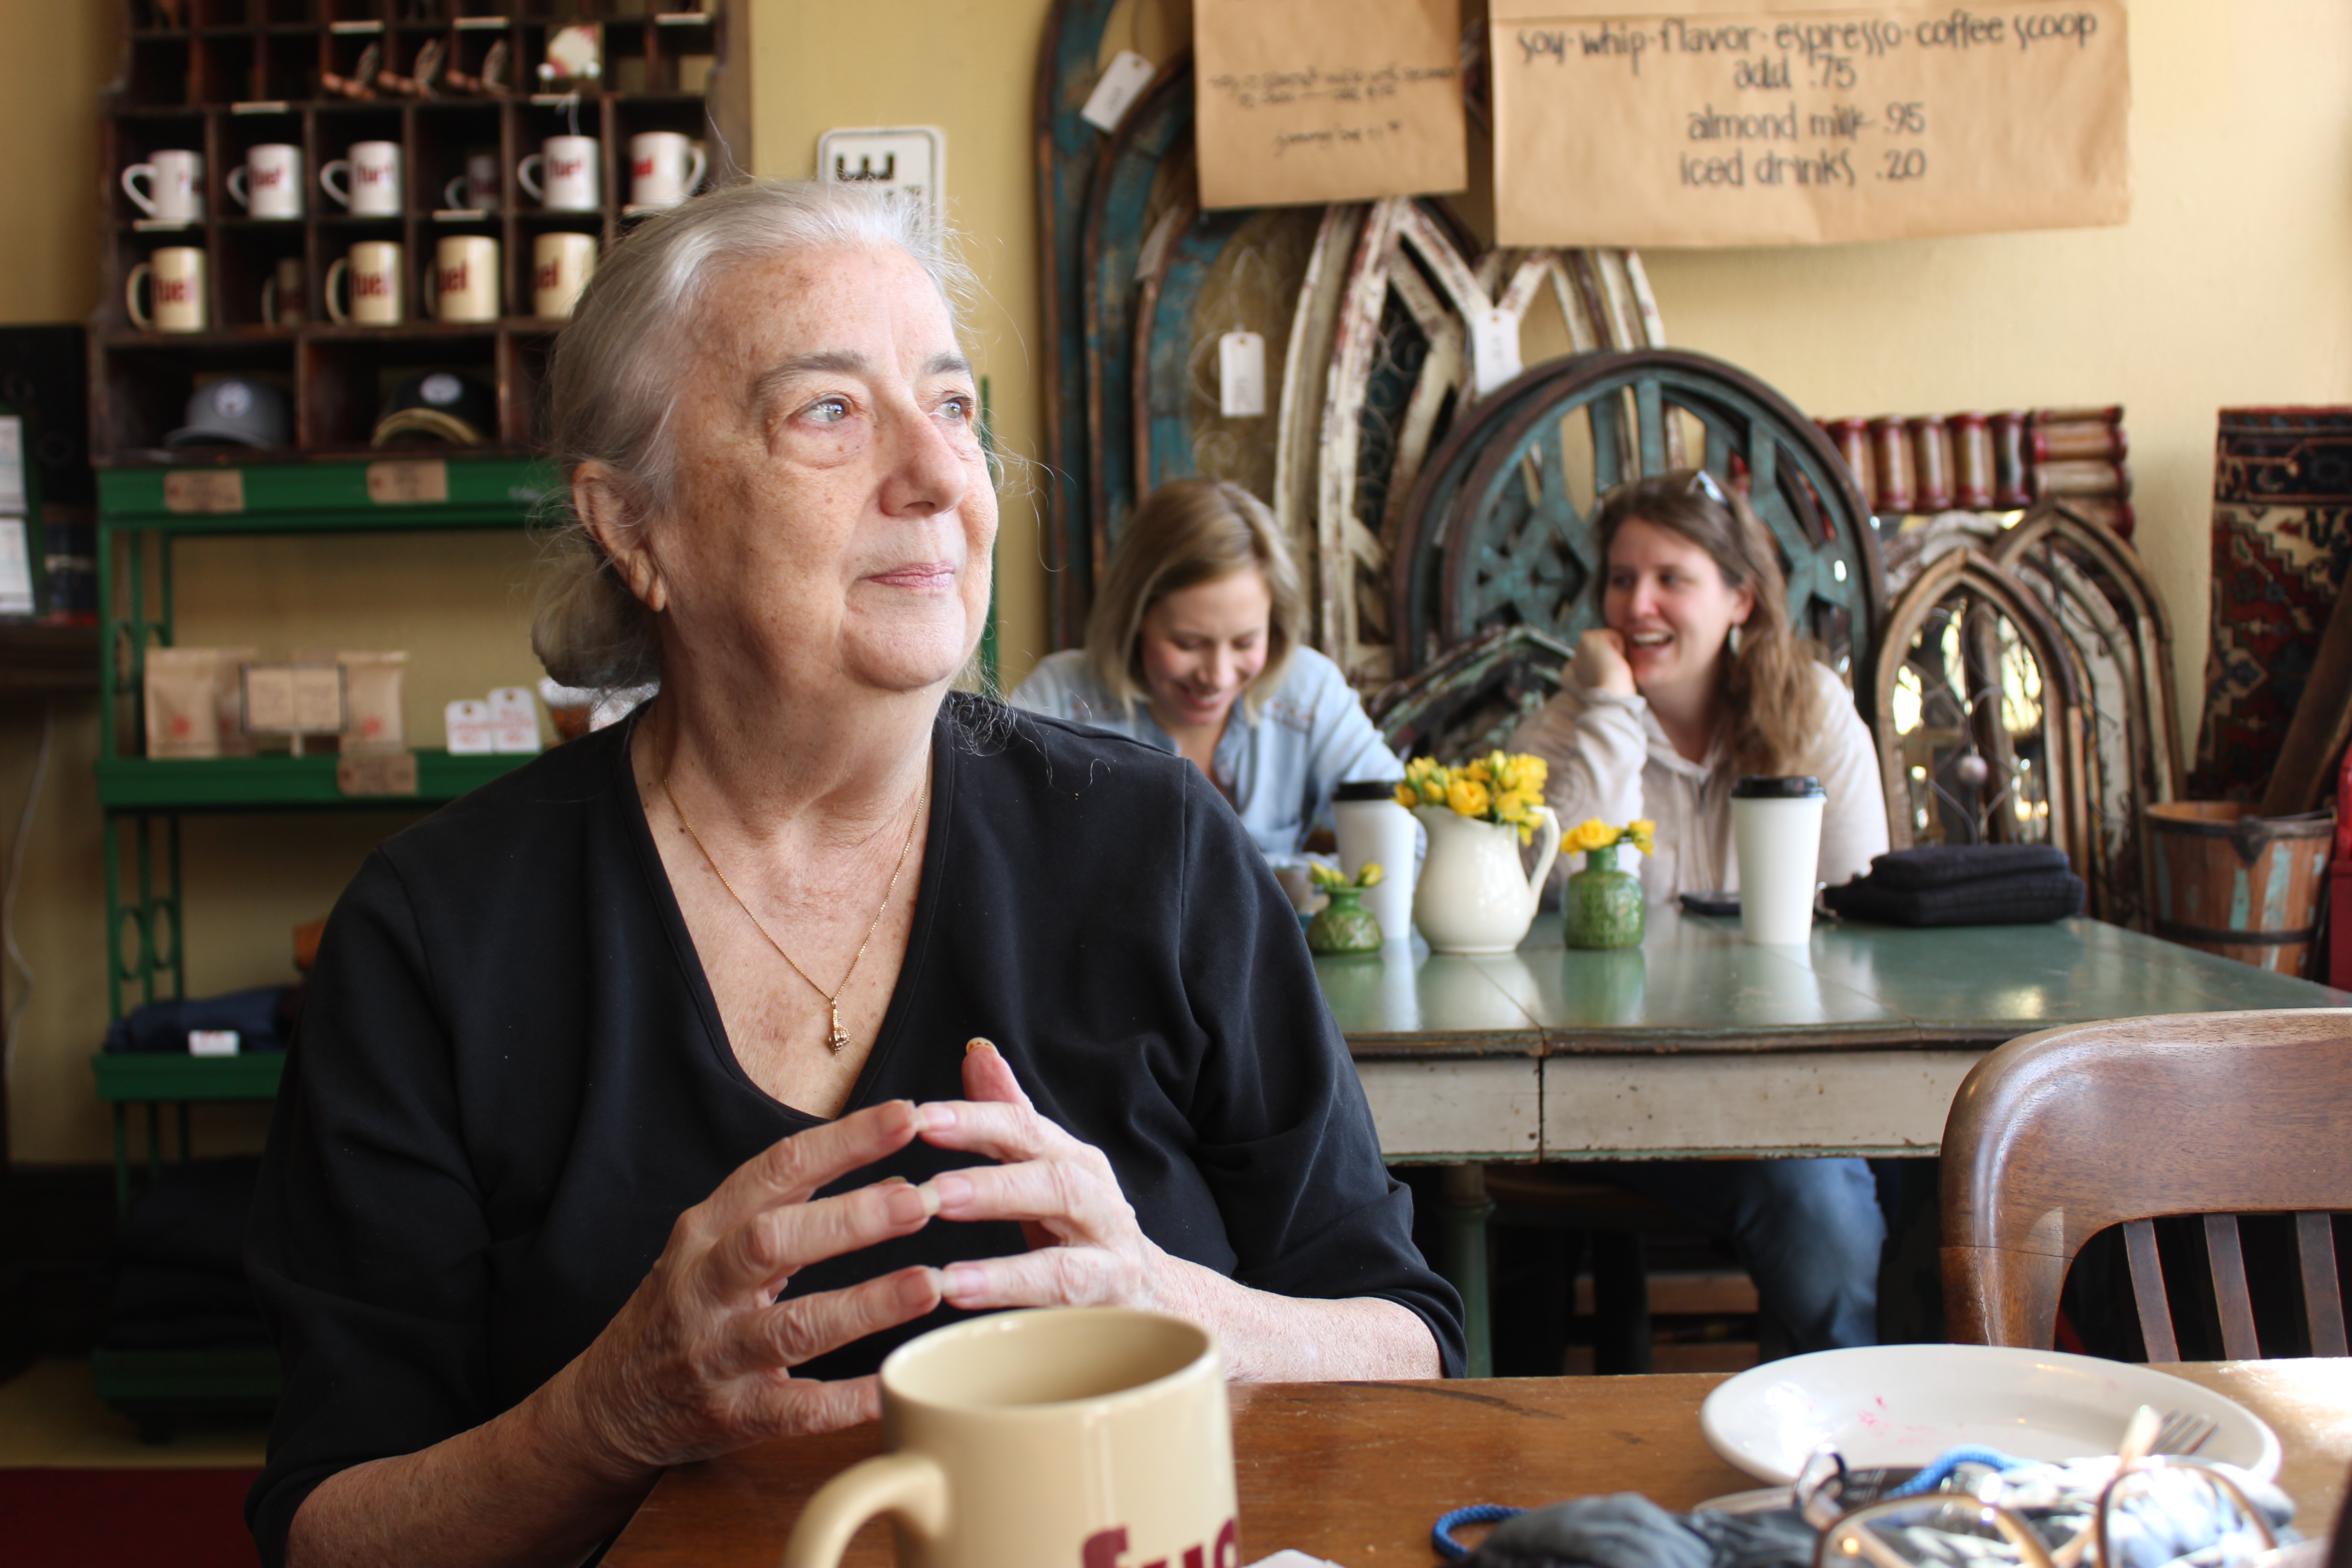
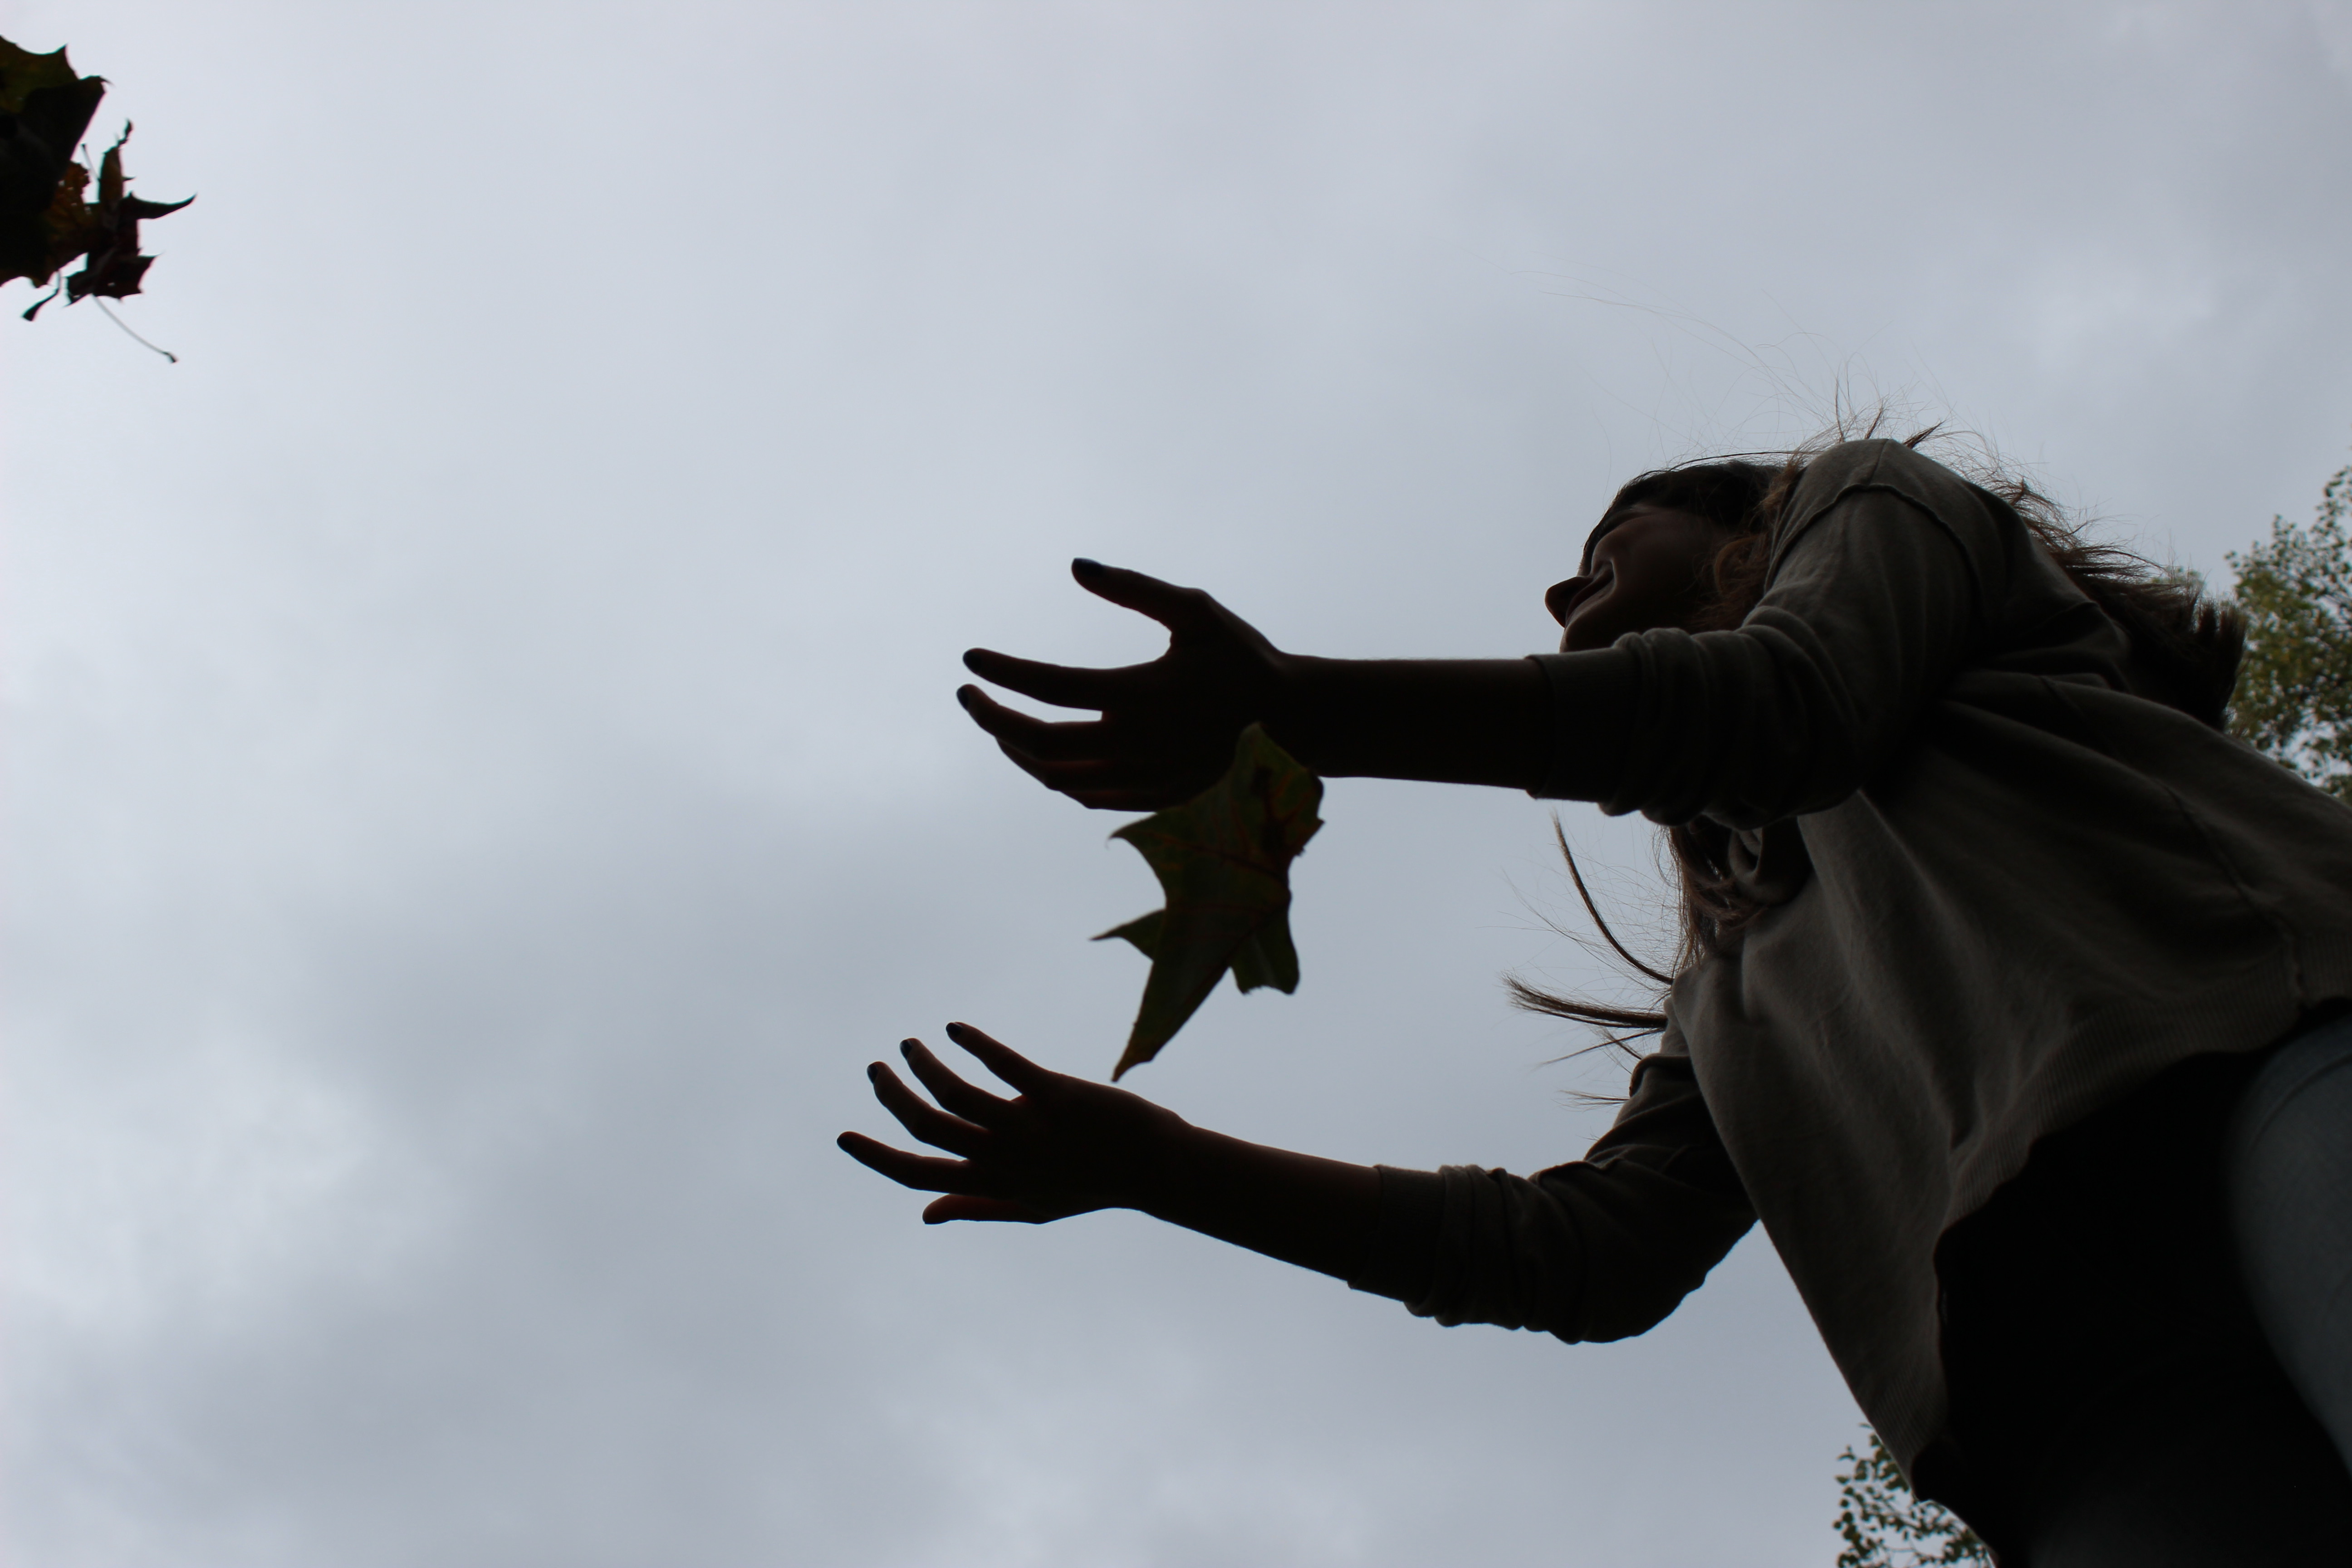
Contemplative
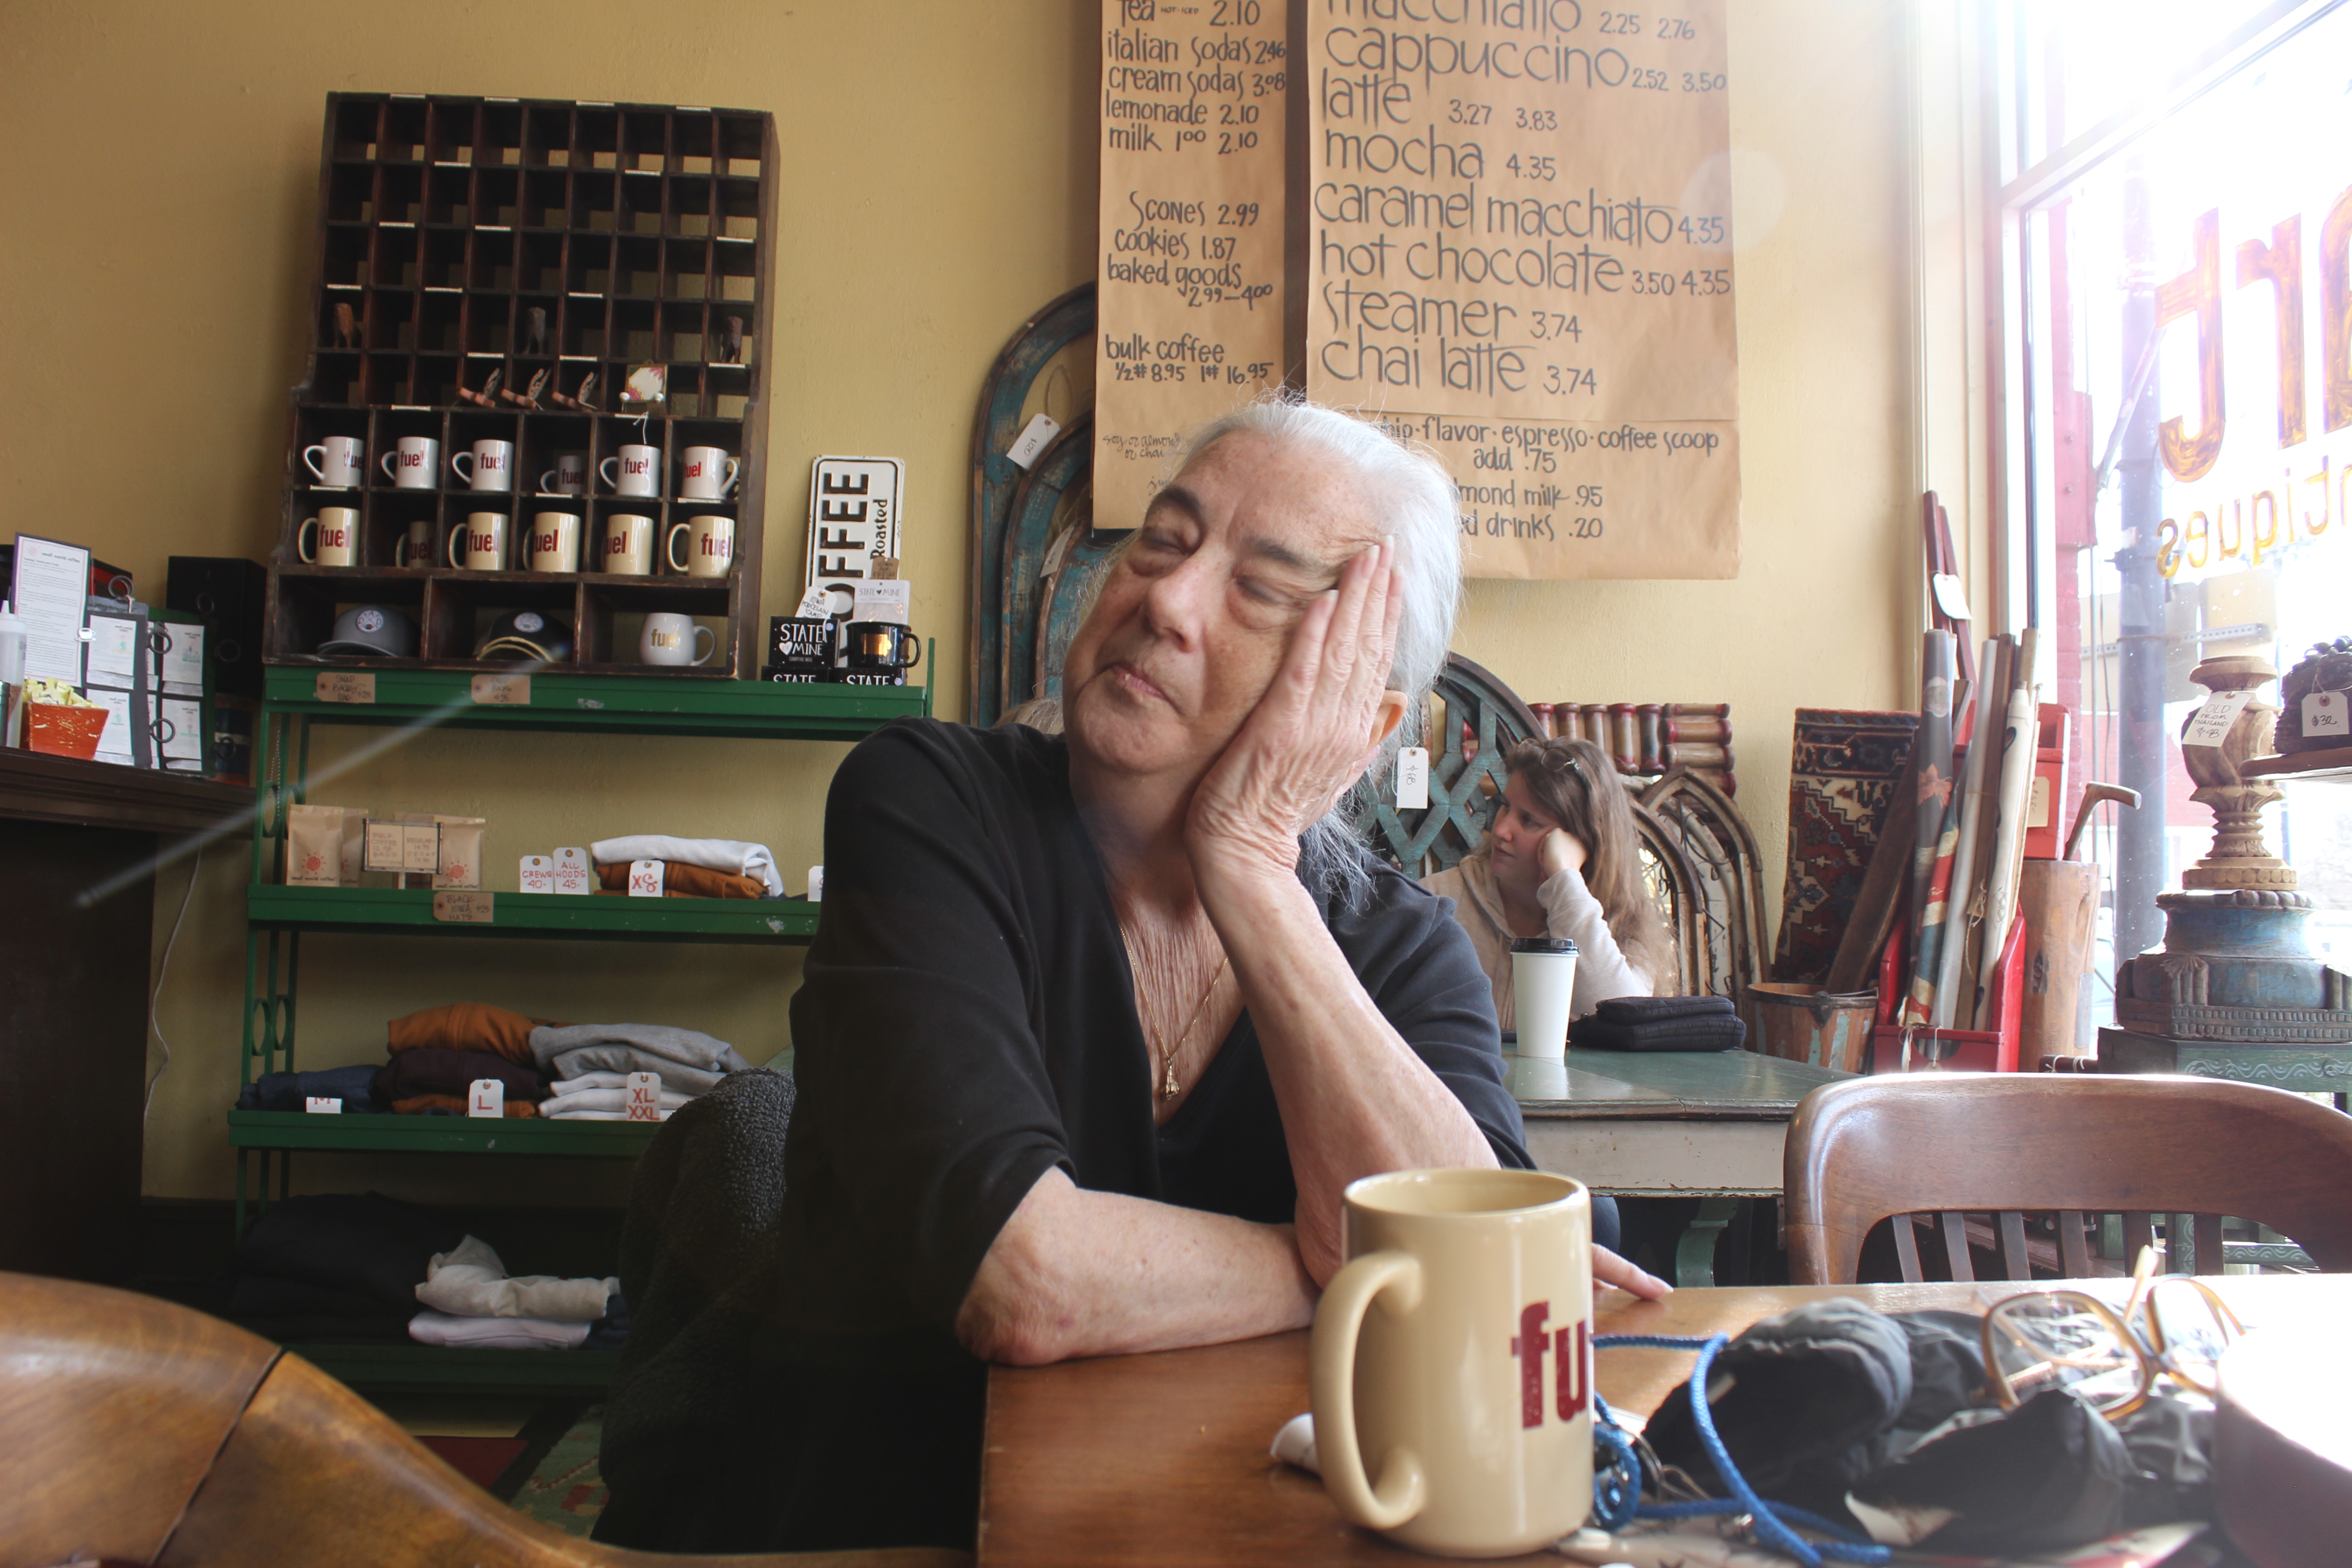
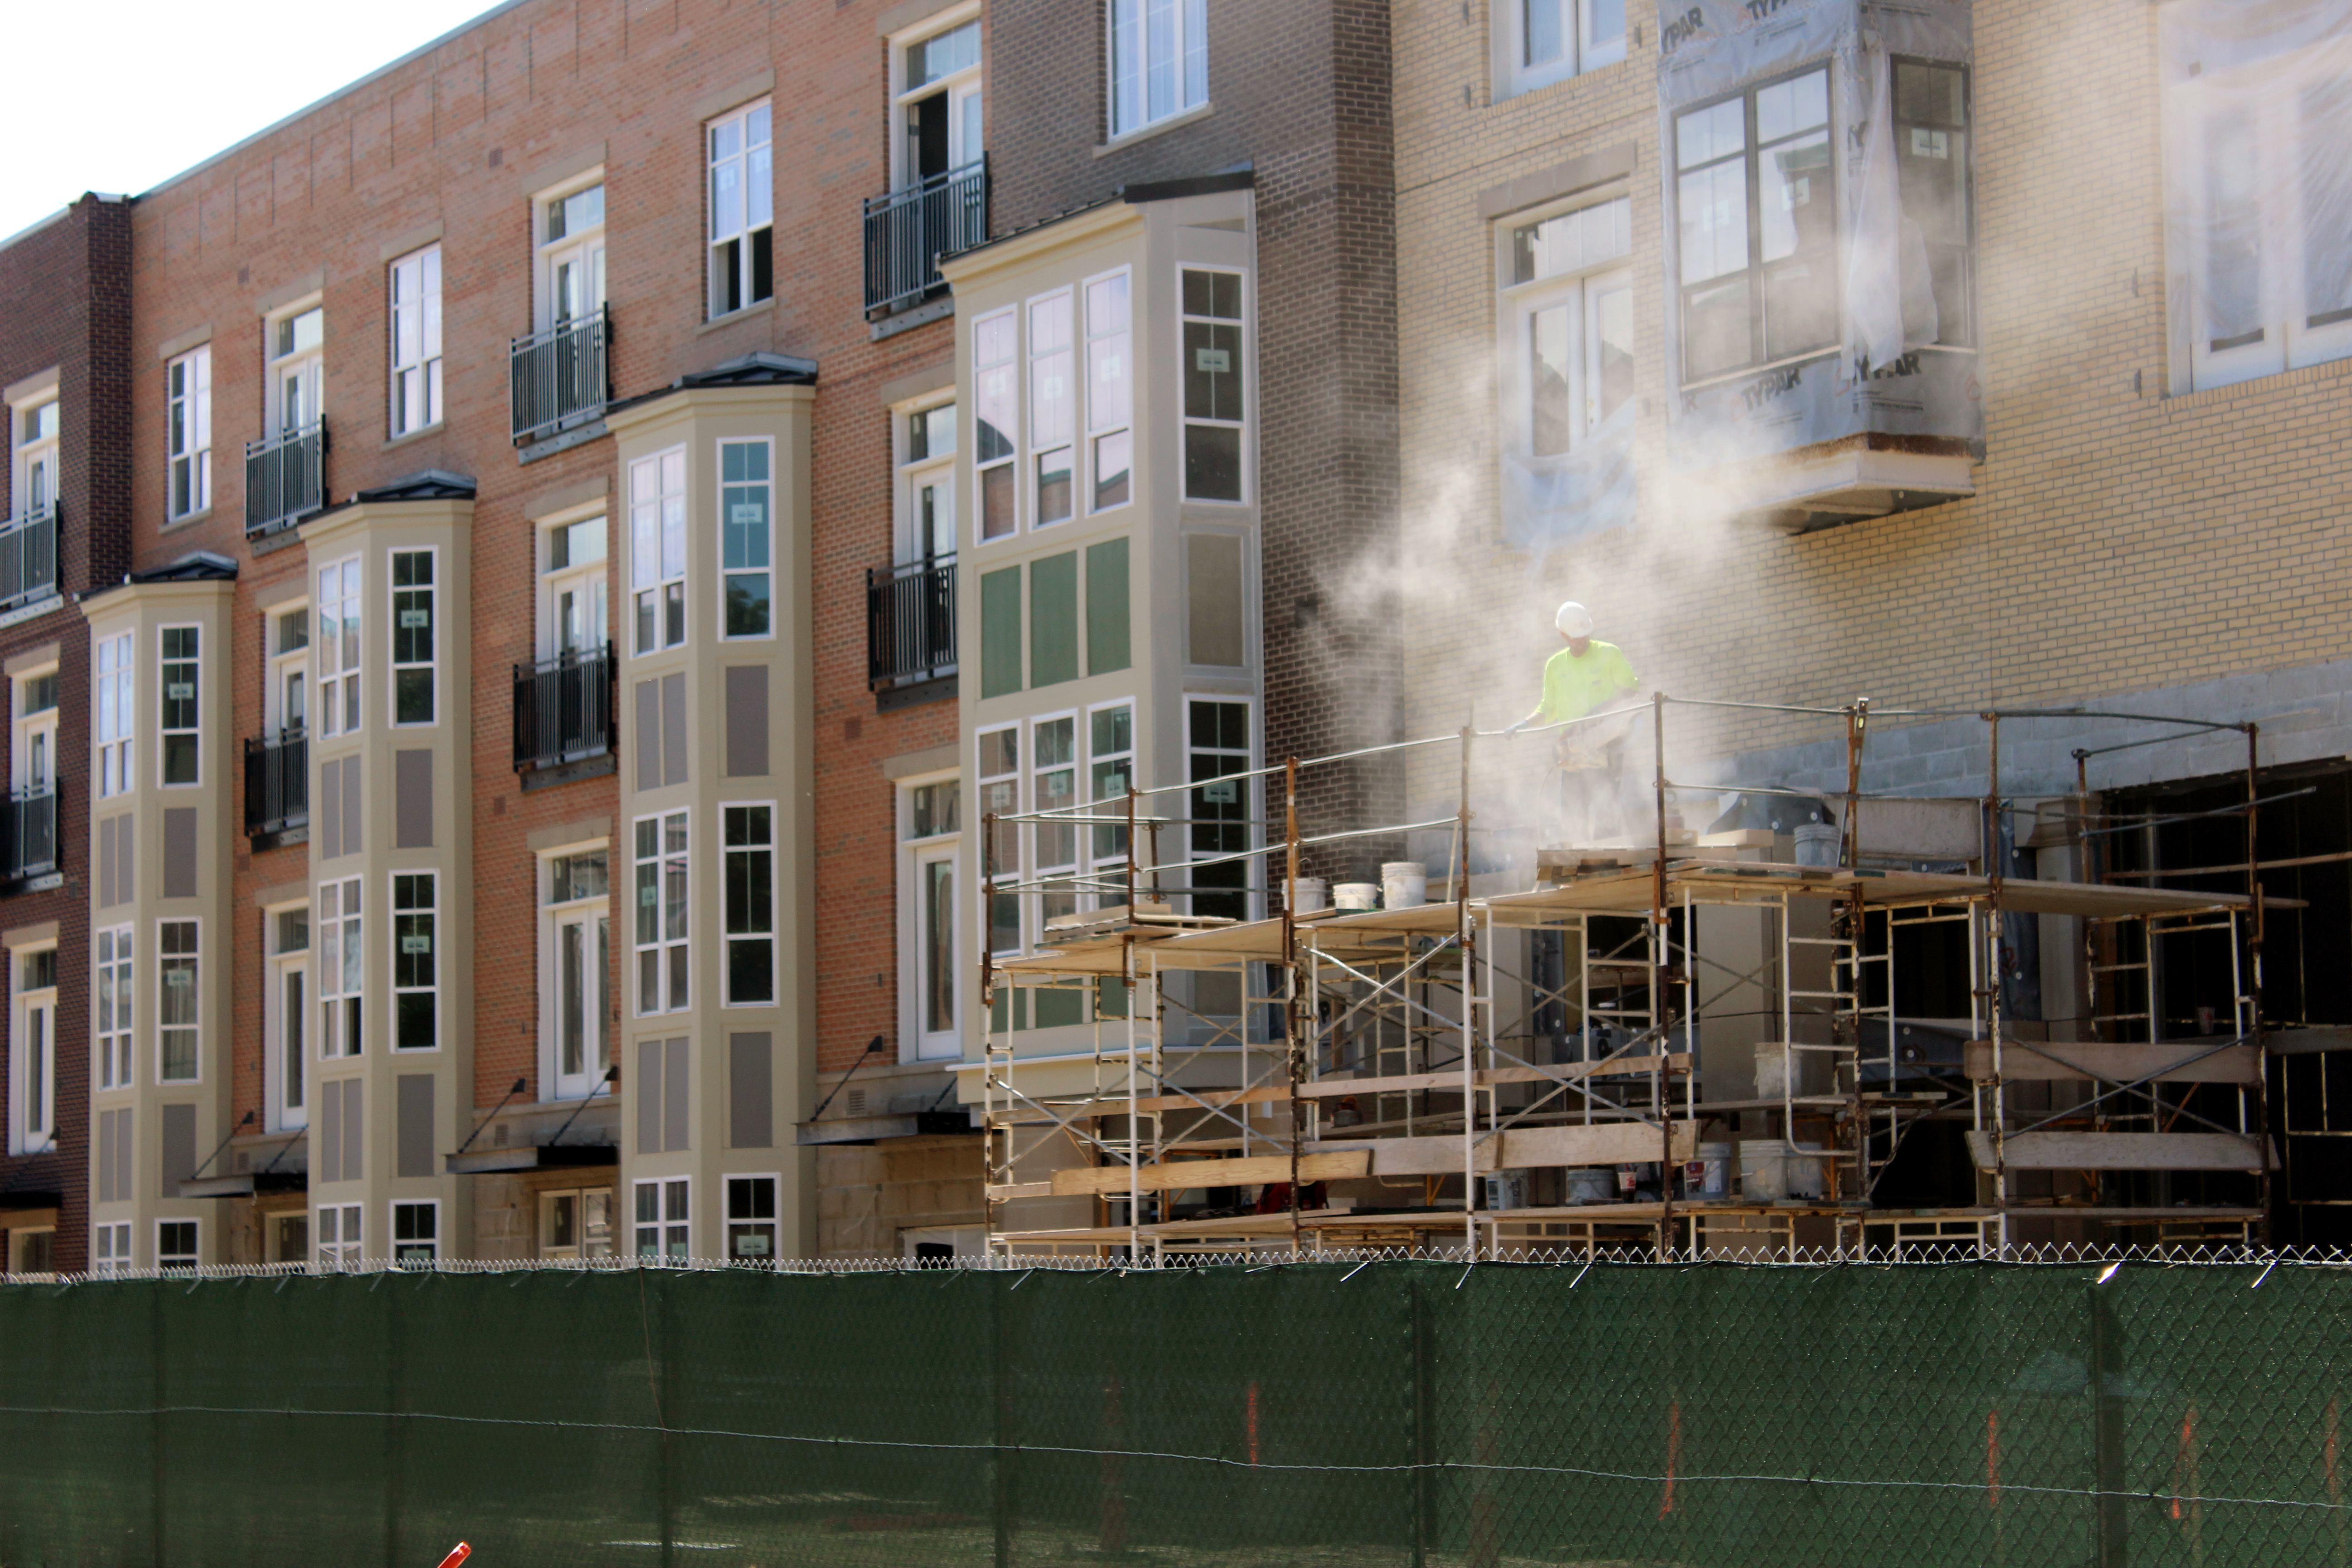
A Worry For The Future
*IMG_0036
*IMG_0107
IMG_9721
IMG_9746
IMG_9737
IMG_0293
IMG_0280
o*IMG_9926
o*IMG_9949
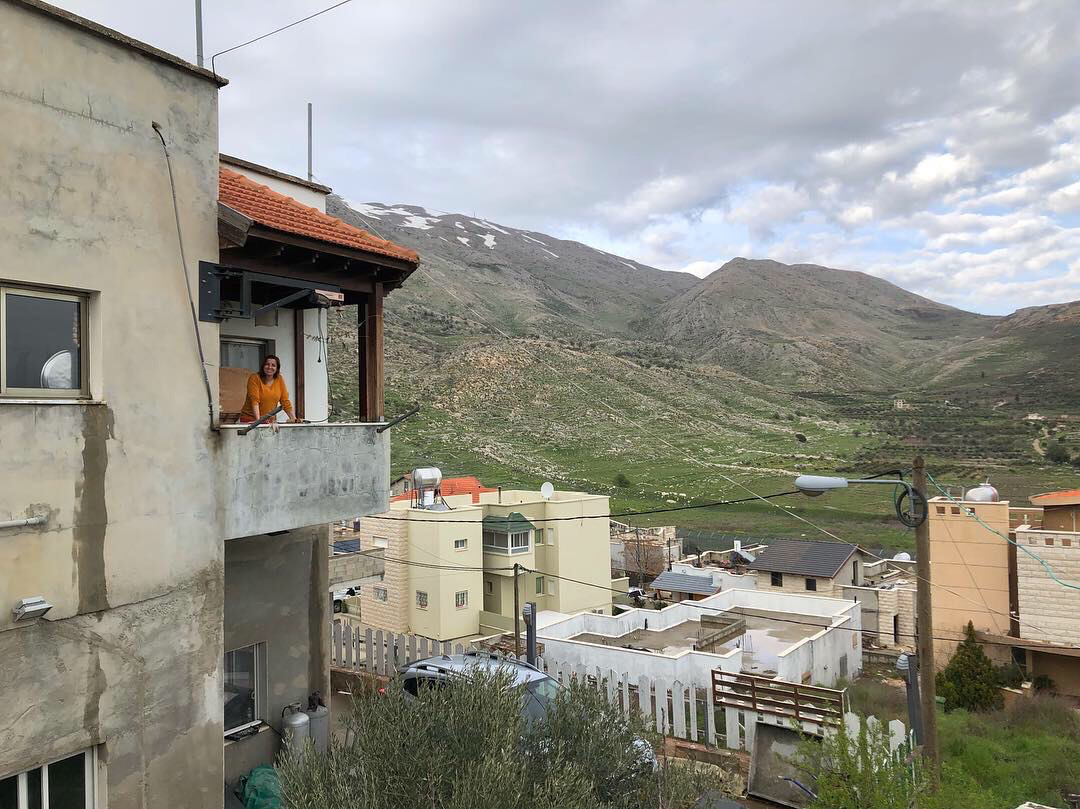
syria
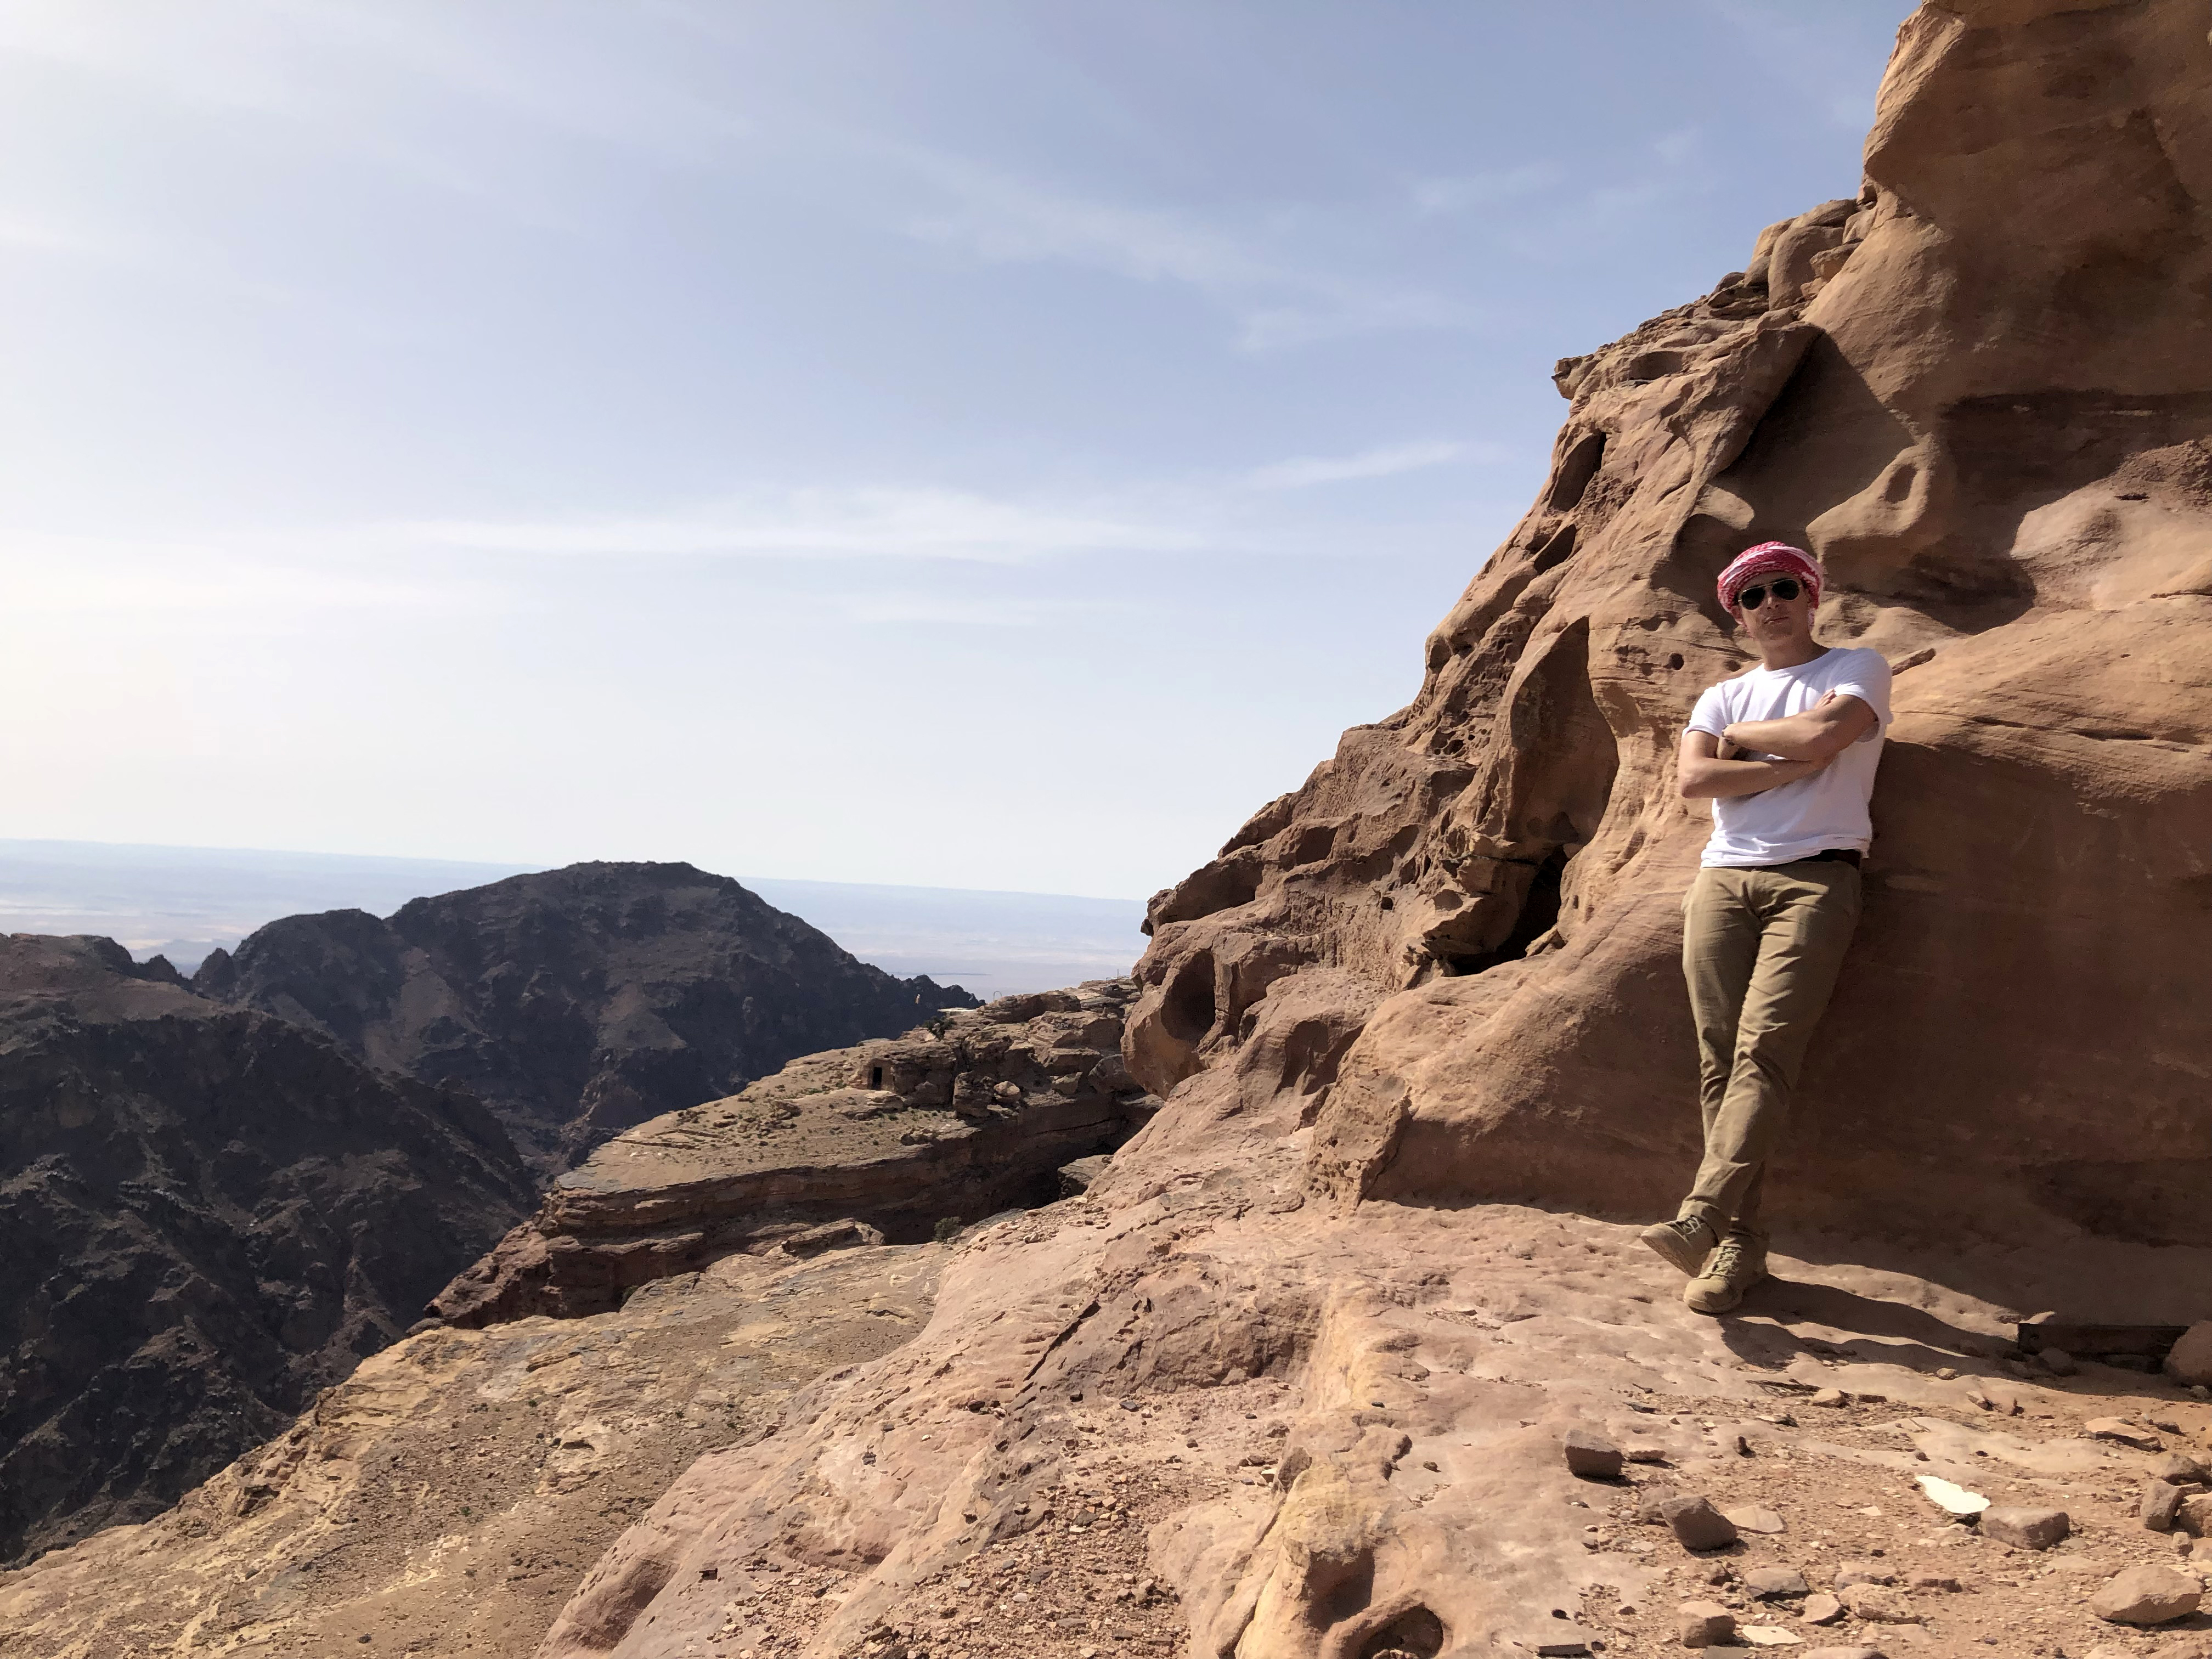
evan
church
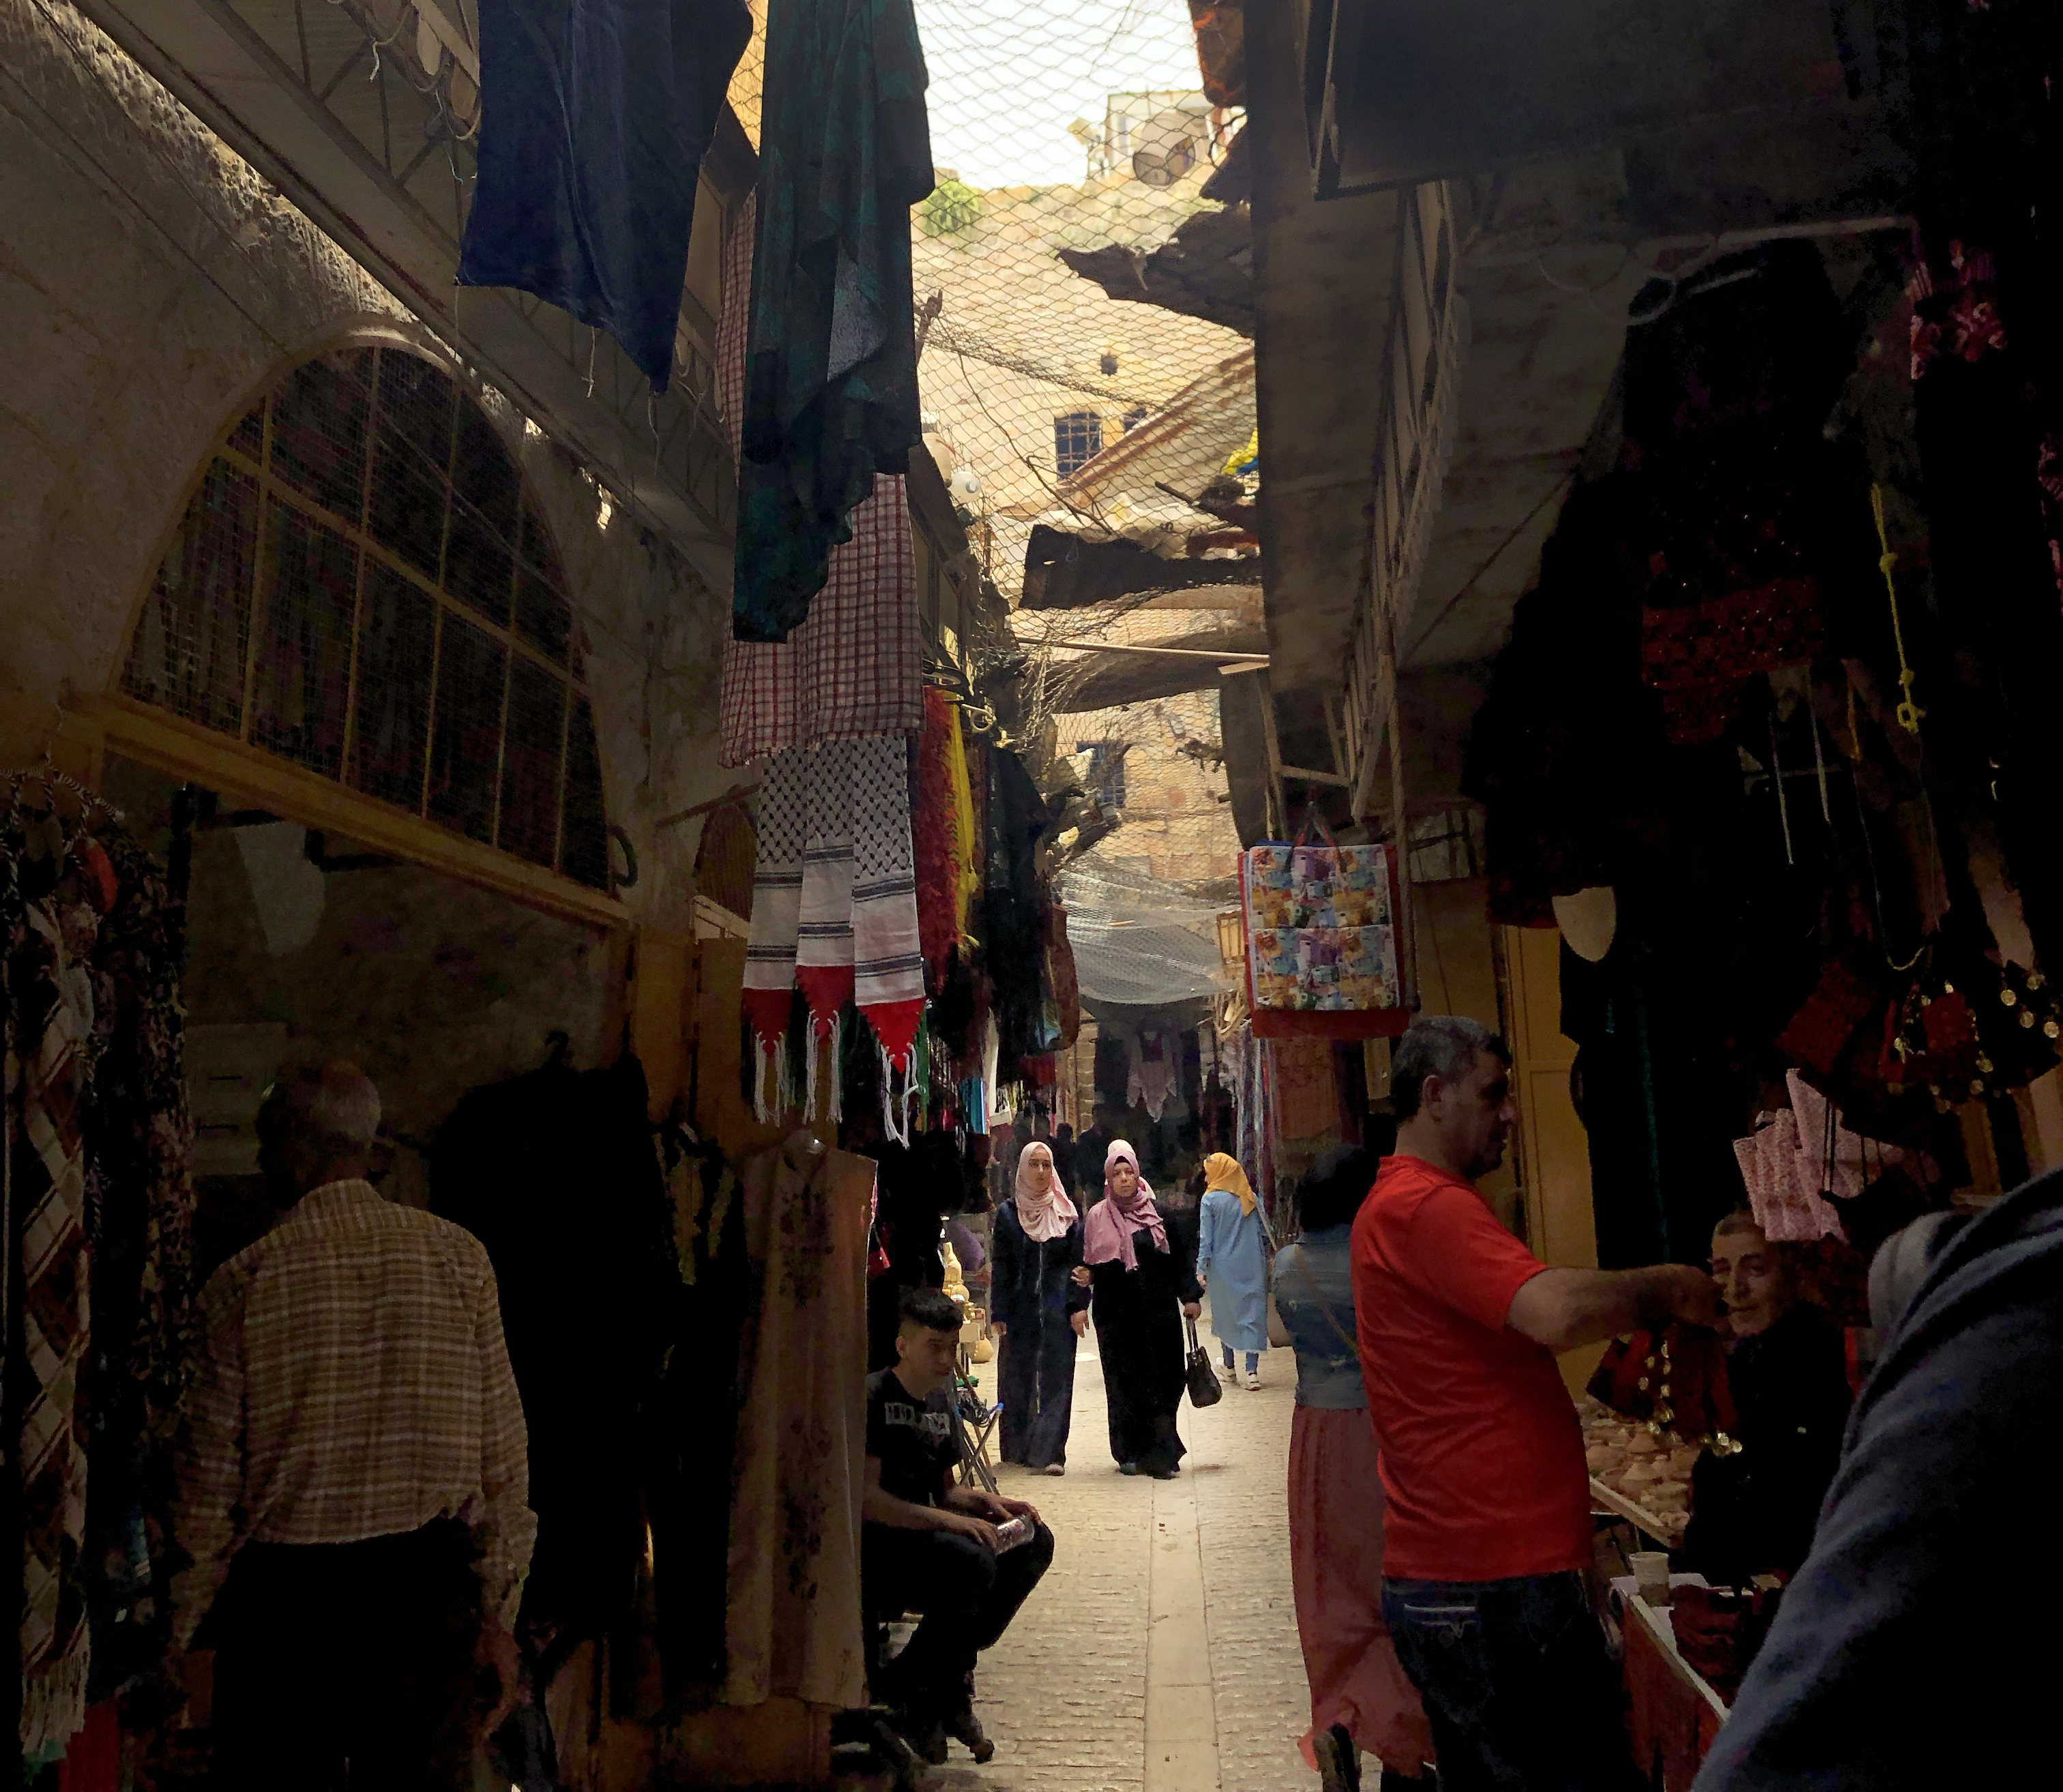
palestine
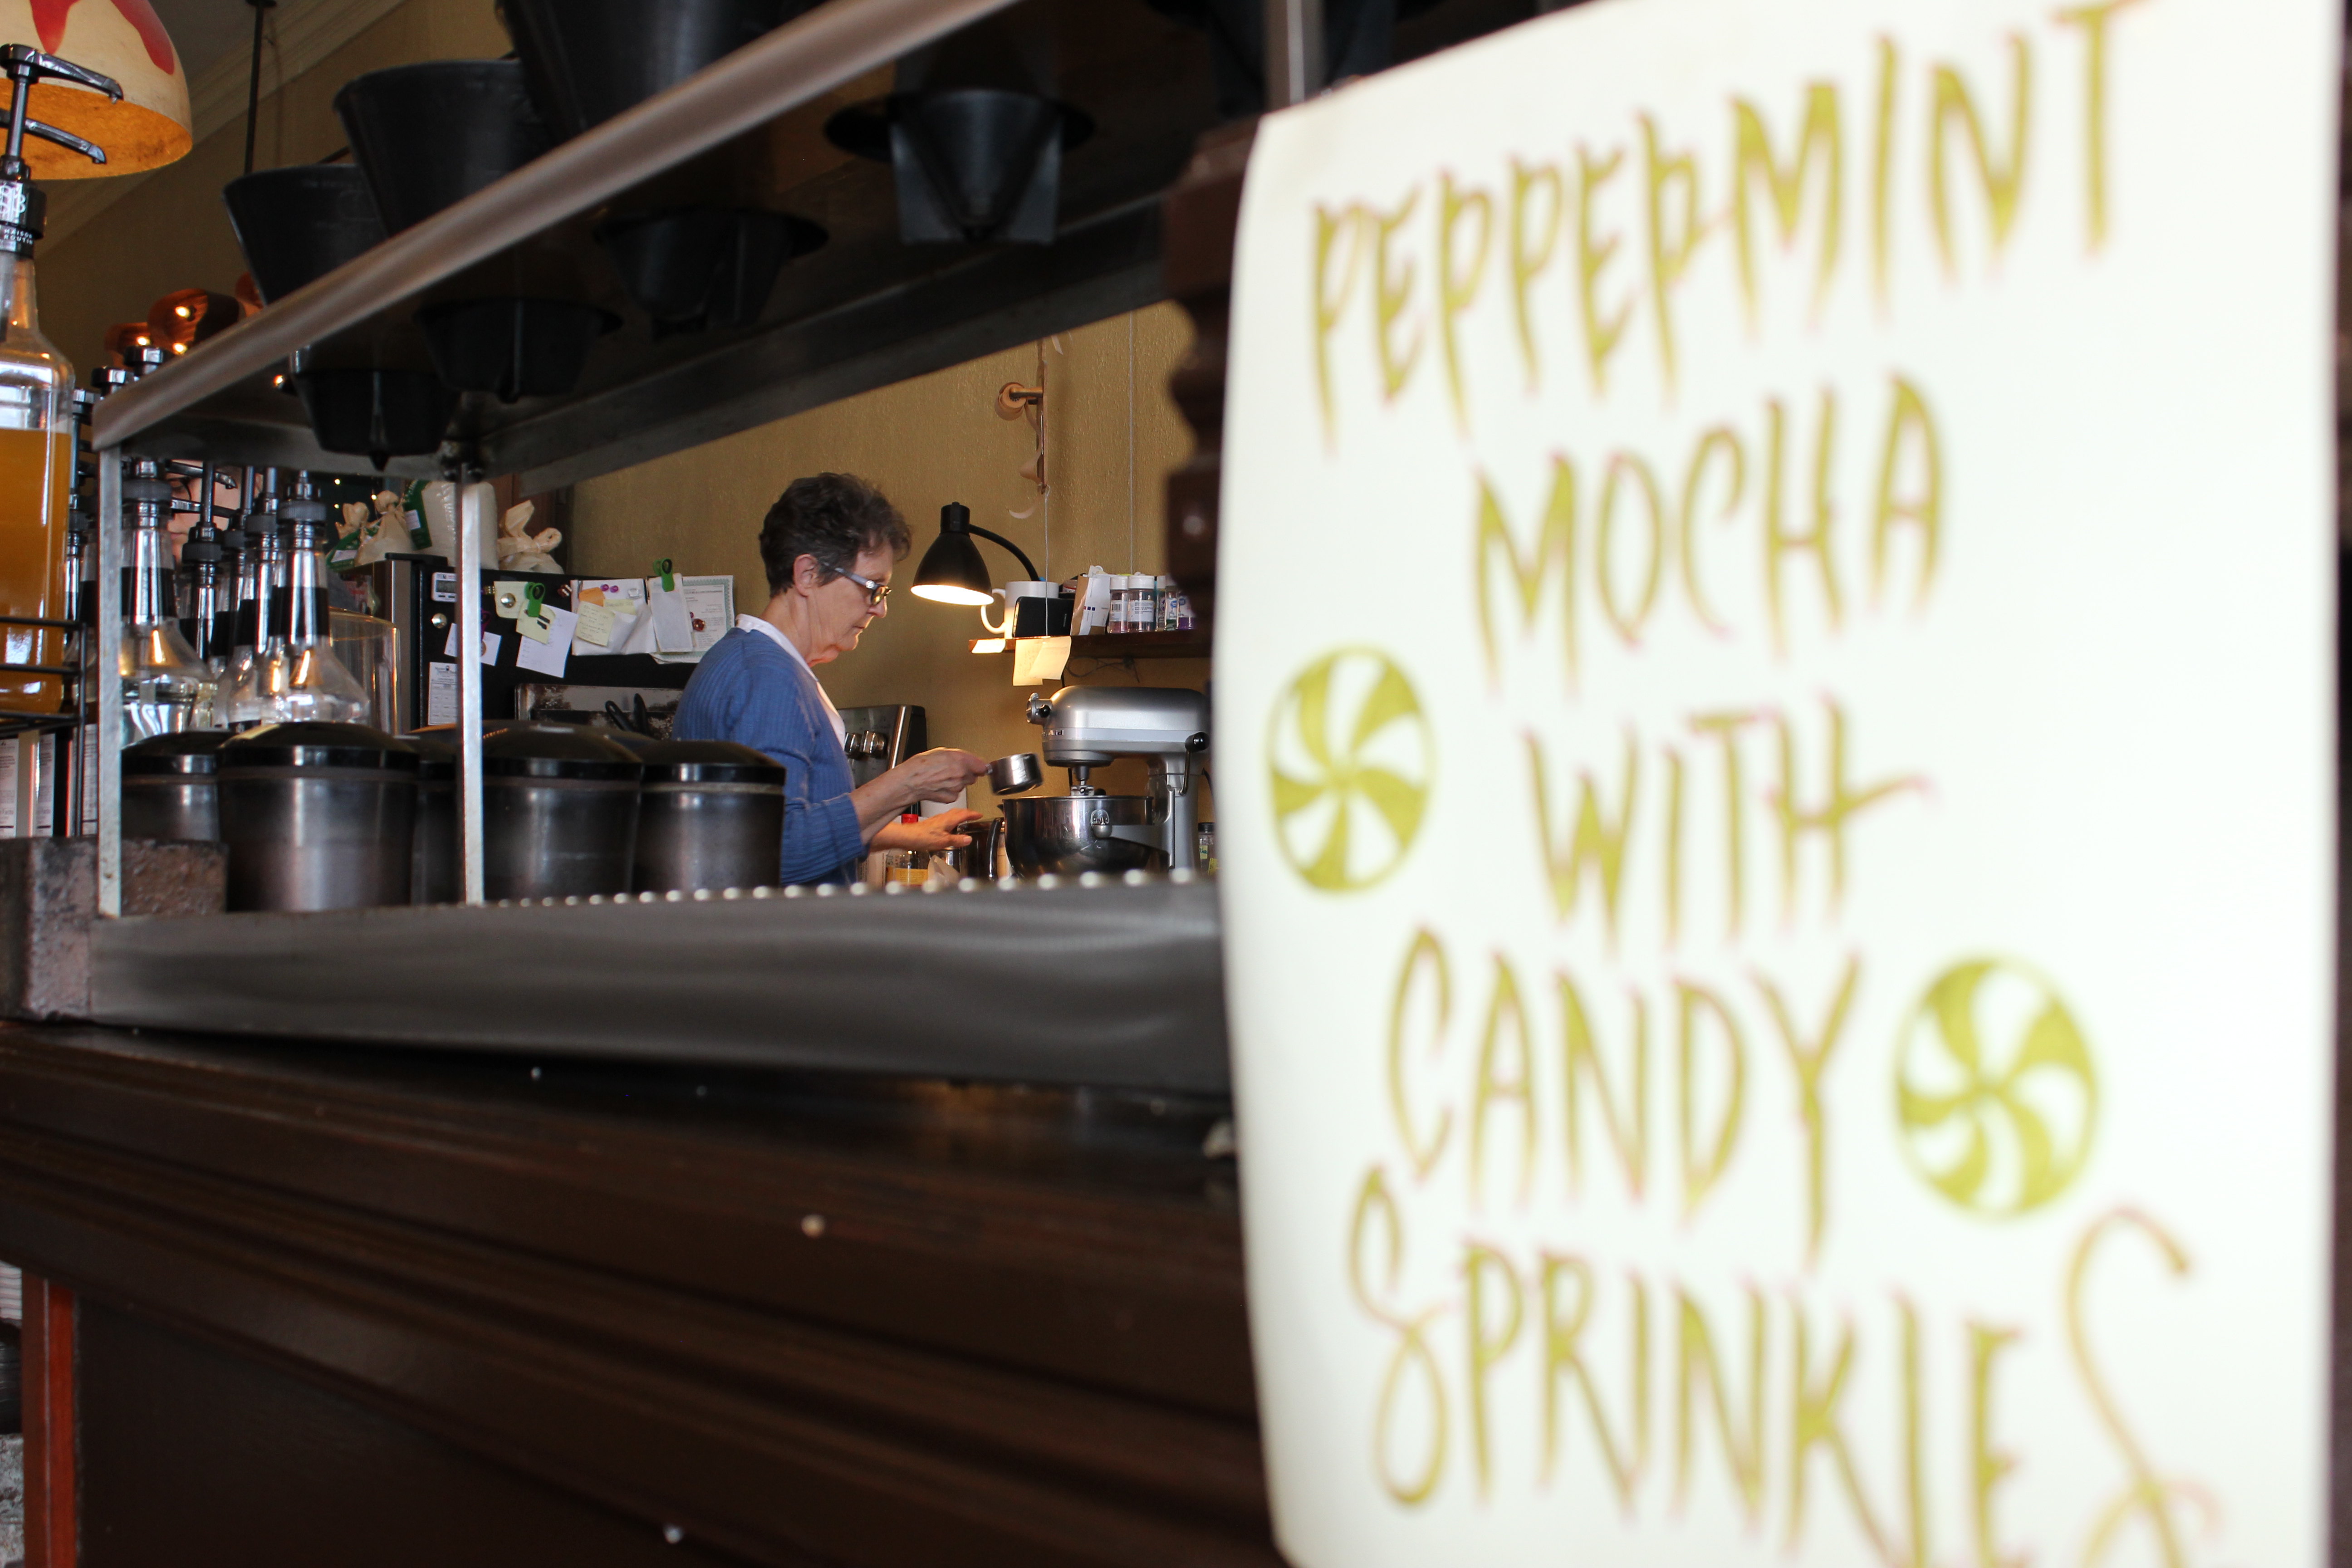
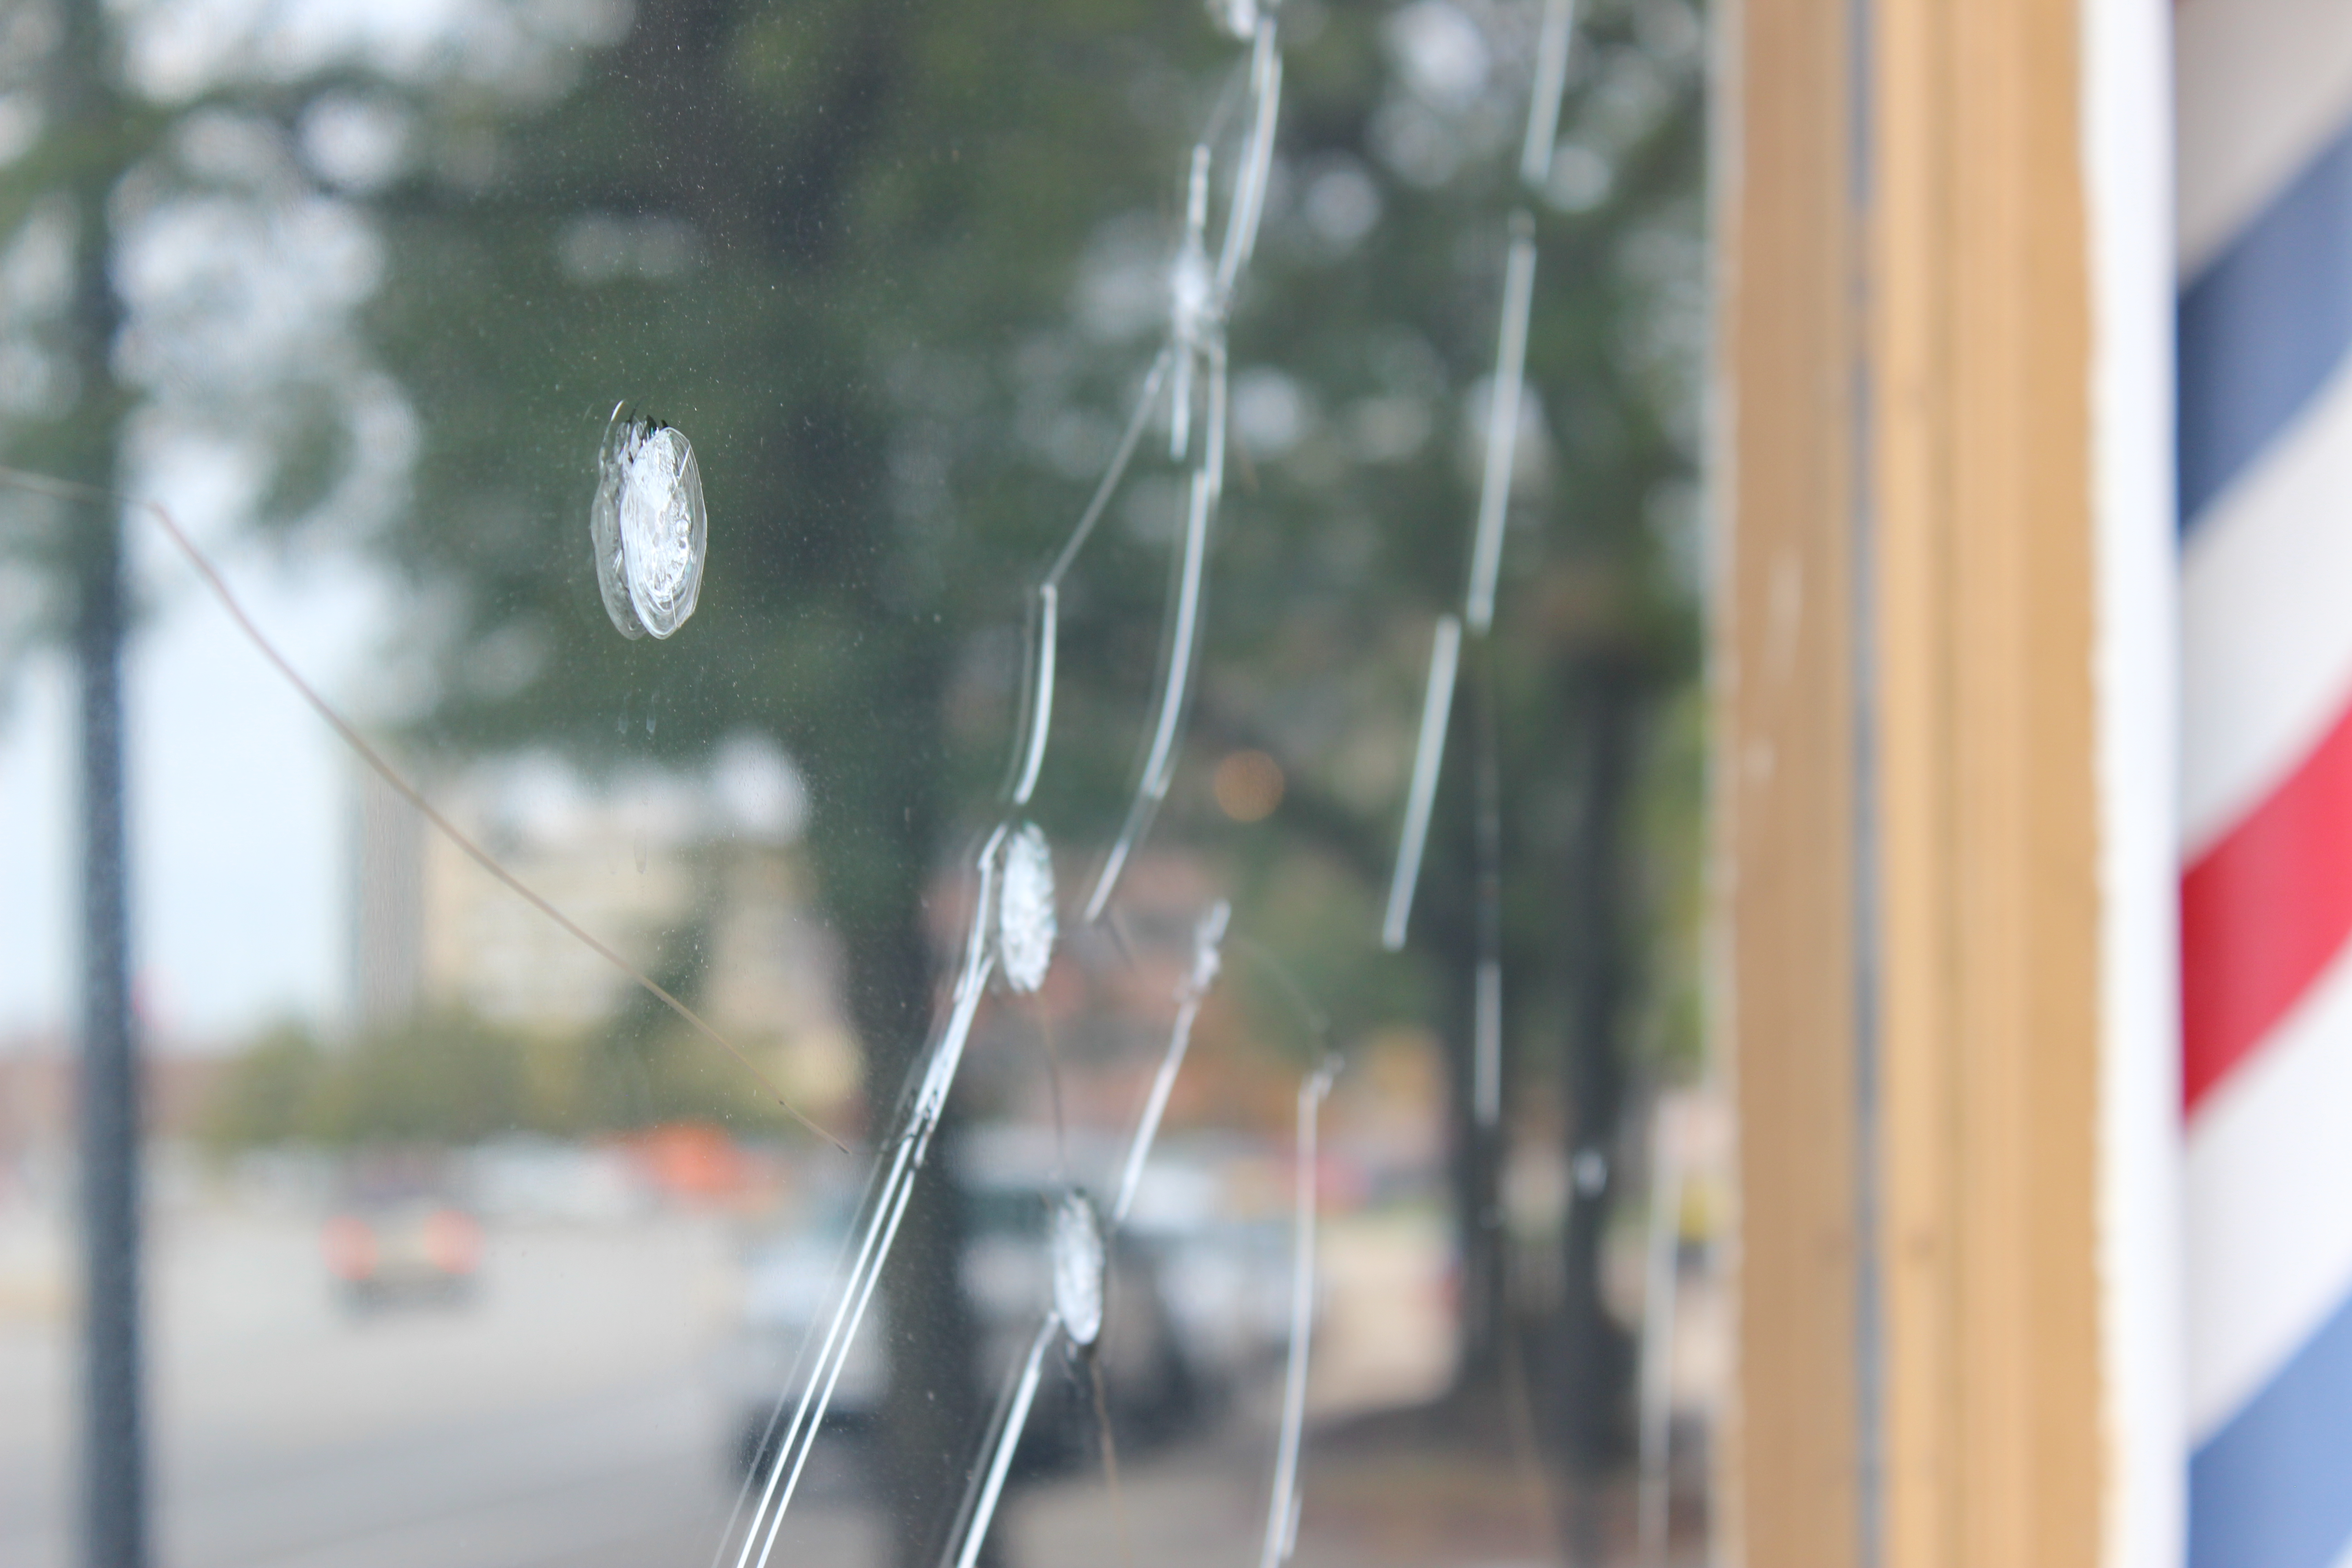
Close Up
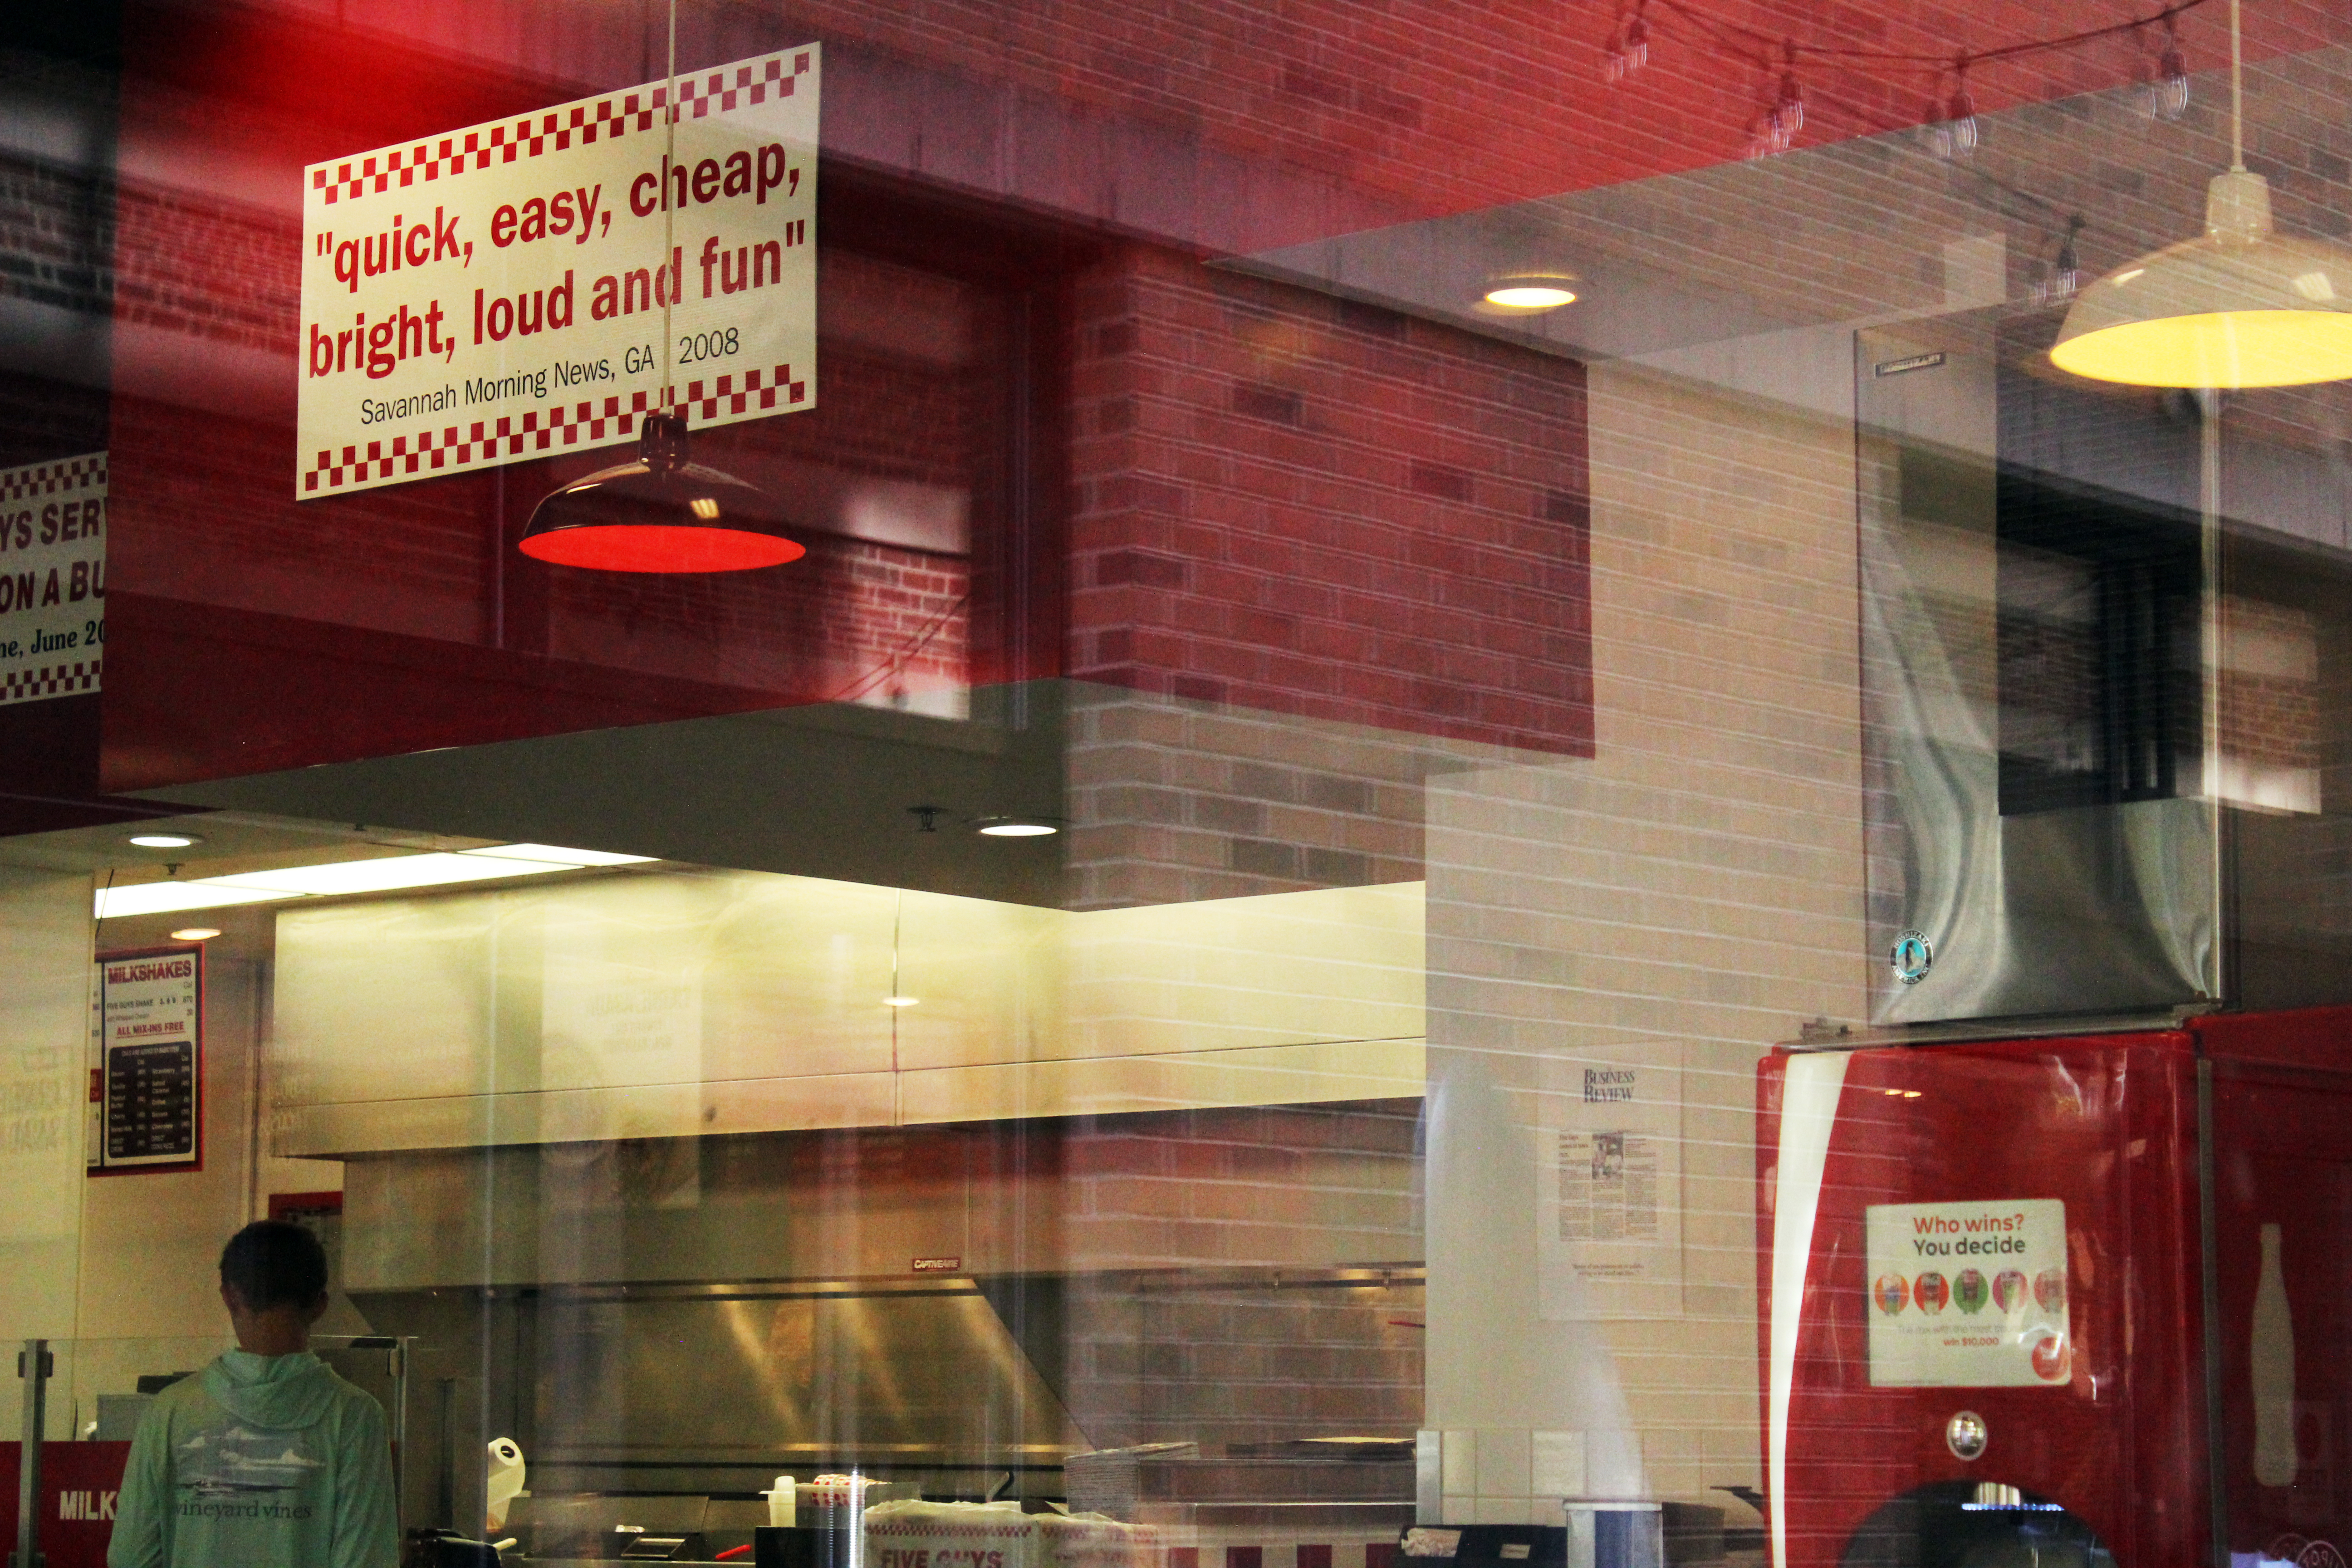
Five Guys
_IMG_9473
***IMG_9224(1)
IMG_9863
IMG_8116
alesnow
Interactive Clips
COVID-19: Mapping the virus’ impact
April 16, 2020
COVID-19: Mapping the virus’ impact
Peruse this map to read and hear about the transformed hometowns, unprecedented adjustments and meaningful moments marking the lives of Notre Dame students and faculty across the globe.
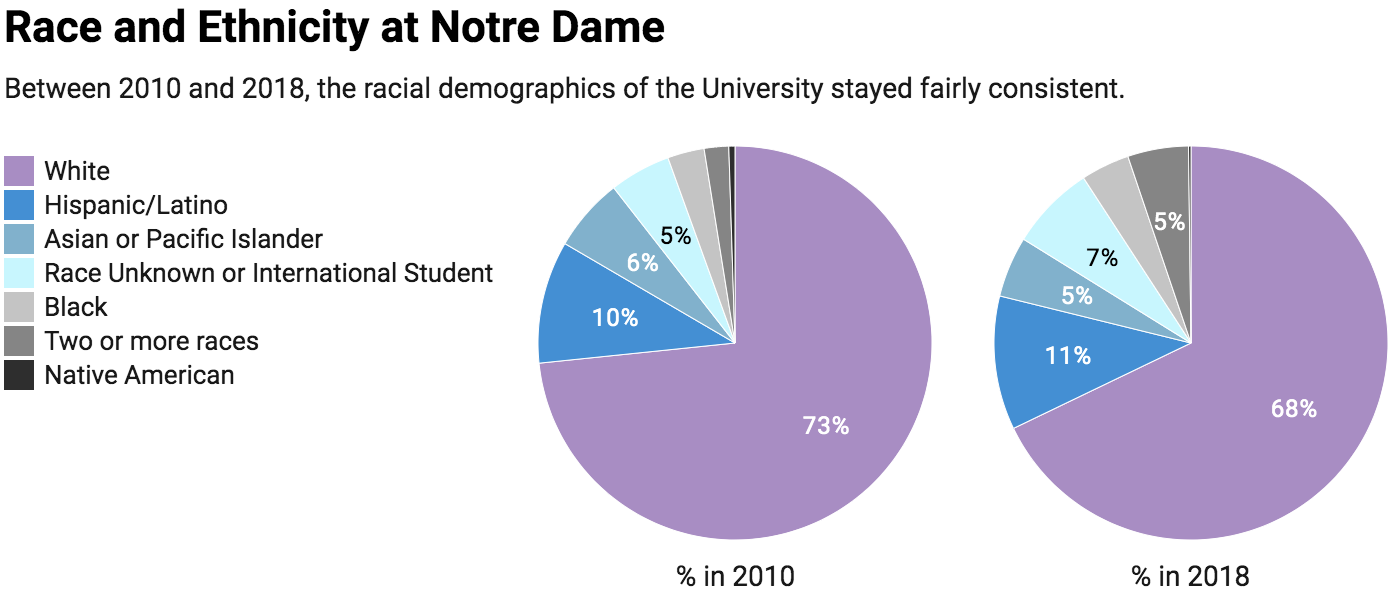
A decade of data: Notre Dame’s 2010s by the numbers
January 15, 2020
A decade of data: Notre Dame’s 2010s by the numbers
Scroll over the graphs to take a look at how Notre Dame has changed since 2010, focusing on tuition, enrollment, demographics, crime, campus infrastructure, research spending and endowment.